AWS conntrack issue
We had an incident where all three of our AWS GovCloud environments simultaneously experienced connection issues. In this post I'm going to explain how I navigated through this minefield. In the end, Amazon's hidden conntrack limits prevented our customers from reaching our instances. They swapped out some hardware for us and it was fixed.
Initial report
A customer reported an issue with login, it was terribly slow. Login is normally a bit slow; the password hashing algorithm makes it slow intentionally. However, this was outrageously slow. Once the customer was able to login, everything worked great. This behavior made it feel like authentication was the issue, it wasn’t, but I didn’t know that yet.
Verify the issue
First I confirmed the issue by checking our request logs, and for multiple customers there were unusually high wait times for logging in. But also notable, this didn’t exist for every login. Some had reasonable response times. I didn’t know what to think about that yet. So I used a test account to login, and I saw no noticeable delay.
Then I checked the source code for any recent changes surrounding the authentication paths, and didn’t notice anything. Authentication hadn’t been changed in a while, any issue with it should have appeared sooner.
So I checked the request logs again. I now noticed every time requests were answered by a specific instance in the load balancer it would be slow, and if answered by a different instance it would be normal. This isn't an issue with our authentication, this is an infrastructure problem!
I verify this with curl:
$ curl -vv "https://guardiantracking.app/test"
*   Trying 18.252.23.213:443...
* TCP_NODELAY set
* connect to 18.252.23.213 port 443 failed: Connection timed out
*   Trying 18.252.154.232:443...
* TCP_NODELAY set
* After 84938ms connect time, move on!
* connect to 18.252.154.232 port 443 failed: Connection timed out
*   Trying 18.253.103.47:443...
* TCP_NODELAY set
* Connected to guardiantracking.app (18.253.103.47) port 443 (#0)
Here it's clear multiple pathways aren't working correctly. We have a loadbalancer with 3 public subnets and only one of them is responding.
At this point I reached out to a coworker whose role is more focused on AWS infrastructure, and notified the team we’re having performance issues in production.
Debugging AWS
My coworker suggests turning on VPC flow logs to get better information. We also triple check the security groups and NACLs for everything. Nothing looks unusual.
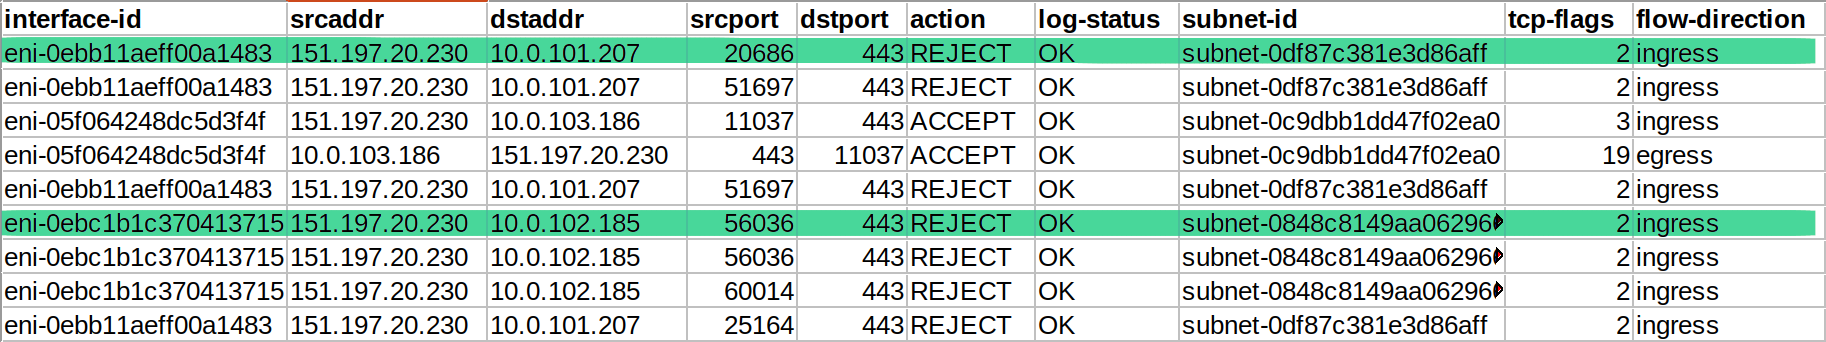 VPC flow log
The flow logs are showing traffic is being rejected. This is confusing, we can't find any NACLs or Security Groups that would reject traffic to port 443 for these interfaces.
We file a support case and they immediately want to jump on a video call with us. We explain everything we’ve found, we triple check all the security groups and NACLs again. Our support technician steps away to work with higher level AWS support people, and will come back.
Testing a load balancer
A load balancer can be annoying to test, especially if you can't reach a specific instance. With our configuration it's completely up to how the DNS query resolves. So I whipped up a solution to constantly check if the servers were all responding.
while true; do sudo systemd-resolve --flush-caches; curl -vv 'https://guardiantracking.app/test' 2>&1; sleep 1; done
Conntrack
The AWS technician determines our Elastic Network Interfaces have reached their conntrack limits. This limit determines how many simultaneous connections can be received by server. The actual number for this limit isn’t published anywhere. Our technician mentions the hardware is faulty and will be swapped out, which means they'll also replace our existing Elastic Network Interfaces. Once they've done that the connectivity is restored, which I can verify with my little script above.
We were happy to be back up, but confused why we hit the conntrack limit. Our application has maybe 40-100 active users at any given time. This small amount shouldn't come close to a conntrack limit. What's more confusing is how this simultaneosly affected all 3 environments, each with their own VPC.
Follow up
We follow up with support about this issue to get some answers, but it doesn’t go anywhere. The best advice they can give us is to replace some of our Security Group rules with NACLs. There was never any explanation why the hidden conntrack limit affected all three separate environments. That’s the spookiest part to me. We followed their suggestions and haven’t had an issue since.
I wanted to build a better monitoring script, which led me to find the useful --resolve flag for curl, which will resolve a domain as a specified ip address. As a result, I built this script to query for dns records and resolve them all.
#!/usr/bin/env bash

protocol="https"
path="/"
timeout="20"
period=60

function check_elb {
    domain="$1"
    port="$2"

    date
    echo "$domain"

    # Find ip address records, filter out cname with ip regex
    ips=`dig +short -t a $domain | grep '^\([0-9]\{1,3\}\.\)\{3\}[0-9]\{1,3\}'`

    echo "$ips"

    echo -e "$ips" | while read ip; do
        sleep 1;
        HTTP_CODE=$(curl --connect-timeout $timeout \
            --resolve "$domain:$port:$ip" \
            --write-out "%{http_code}\n" \
            --silent \
            --output /dev/null \
            "$protocol://$domain:$port$path"
        );

        if [[ $HTTP_CODE == "000" ]]; then
            echo "$HTTP_CODE $ip $protocol://$domain:$port$path"
            notify-send -u "critical" "$domain timeout" "failed to reach $ip after ${timeout}s"
            continue;
        fi;


        if [[ $HTTP_CODE != "200" ]]; then
            echo "$HTTP_CODE $ip $protocol://$domain:$port$path"
        fi;
    done;

    echo ""
}

while true; do
    check_elb "guardiantracking.app" 443
    sleep $period
done;
We don't have this running now, but it was a useful exercise. We have another uptime monitor we're using.
If you made it this far, thanks for reading!!